“We generated $70K in package protection revenue in a single quarter by adding a simple $4 protection option at checkout — plus an additional $12K from cashbacks. Customers get peace of mind, and we're making a profit on every protected order with zero effort."
“We generated $70K in package protection revenue in a single quarter by adding a simple $4 protection option at checkout — plus an additional $12K from cashbacks. Customers get peace of mind, and we're making a profit on every protected order with zero effort."
Why your Ecommerce brand keeps hitting a growth ceiling
Why your Ecommerce brand keeps hitting a growth ceiling
Learn why more sales can tighten working capital, where fulfillment pressure shows in your financials, and how to find your real Ecommerce growth constraint.
In the early days, an Ecommerce growth strategy can feel simple: sell more, grow more. But as you scale, profit gets harder to hold onto. Every new customer seems to cost more, and the promotions and ad spend that used to work don't move the needle like they once did.
It doesn't add up. When profit stalls, the instinct is to double down on what worked before. More customers, more cash. But somehow, more sales just leave you with less money to spend.
That's the first sign the problem runs deeper than revenue. Your sales can be stronger than ever, but if your inventory and the way you run the business are falling behind, every new order leaves you with less room to invest. This guide will help you find the ceiling that's capping your growth, so you can plan your next move.
Why more revenue can leave you with less
Revenue tells you how much you're selling. It doesn't tell you how much of that turns into cash. If your costs rise faster than your profit per sale, the top line can look great while your bank balance gets tighter every week.
That squeeze shows up in a few ways that don't seem to add up:
Revenue rises while your margin keeps falling
Every new order leaves less cash to reinvest
Inventory swells, but bestsellers still sell out
Holding your sales pace takes bigger or more frequent discounts
Keeping the same pace eats more and more working capital
Growth doesn't create these pressures, but it makes them bigger. Larger orders mean more cash upfront. New markets mean more warehouses to fill. Small inefficiencies that were a minor annoyance at low volume now multiply across every market, supplier, and product.
You can't sell your way out of this. In our 2026 Ecommerce Tariffs Benchmark Report, 91.7% of US Ecommerce businesses said they'd raised prices over the past year. Even so, 78.9% saw their gross margins fall. Pricing can protect part of your margin, but it can't outrun rising costs.
The problem also looks different at different sizes. A $2M brand and a $10M brand can show the same symptoms for completely different reasons. We break down the biggest blockers at each stage and how to get ahead of them.
What if your fulfillment model is setting the ceiling?
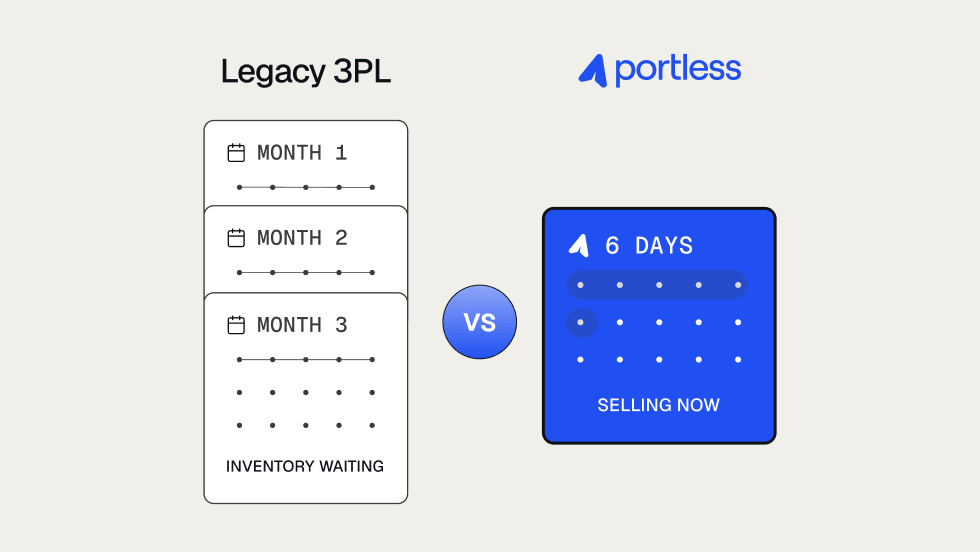
Importing in bulk to local warehouses keeps products close to customers. The catch is that you pay for production, freight, duties, and storage before you make a single sale.
That's manageable with three products in one market. But once you're running 100 SKUs across seven warehouses, each needing its own stock and buffer, the upfront bill balloons. That leaves less cash for marketing, expansion, and quick reorders when demand spikes.
Every warehouse adds another forecast gamble
Freight is slow. Shipping from China takes 30+ days to the US West Coast, and almost twice that to Northern Europe. And that's before production time and the drive from port to your warehouse.
Long replenishment cycles don't just trap cash at sea. They stop you acting on demand. Your marketing team spots a trend in Germany, but by the time you make the product and ship it over, you're selling last month's bestseller to customers who've moved on.
Now you've got stock stranded in the wrong place, racking up storage fees. And if that same product takes off somewhere else, you either pay to make more or pay to ship what you already own across the world.
Tariffs raise the stakes
Tariffs add another cost before you've earned a thing. With bulk importing, you pay duties the moment stock clears customs. That's fine when tariffs are steady, but they rarely are. In our 2026 report, 62% of brands named high or unpredictable tariff costs as their biggest challenge.
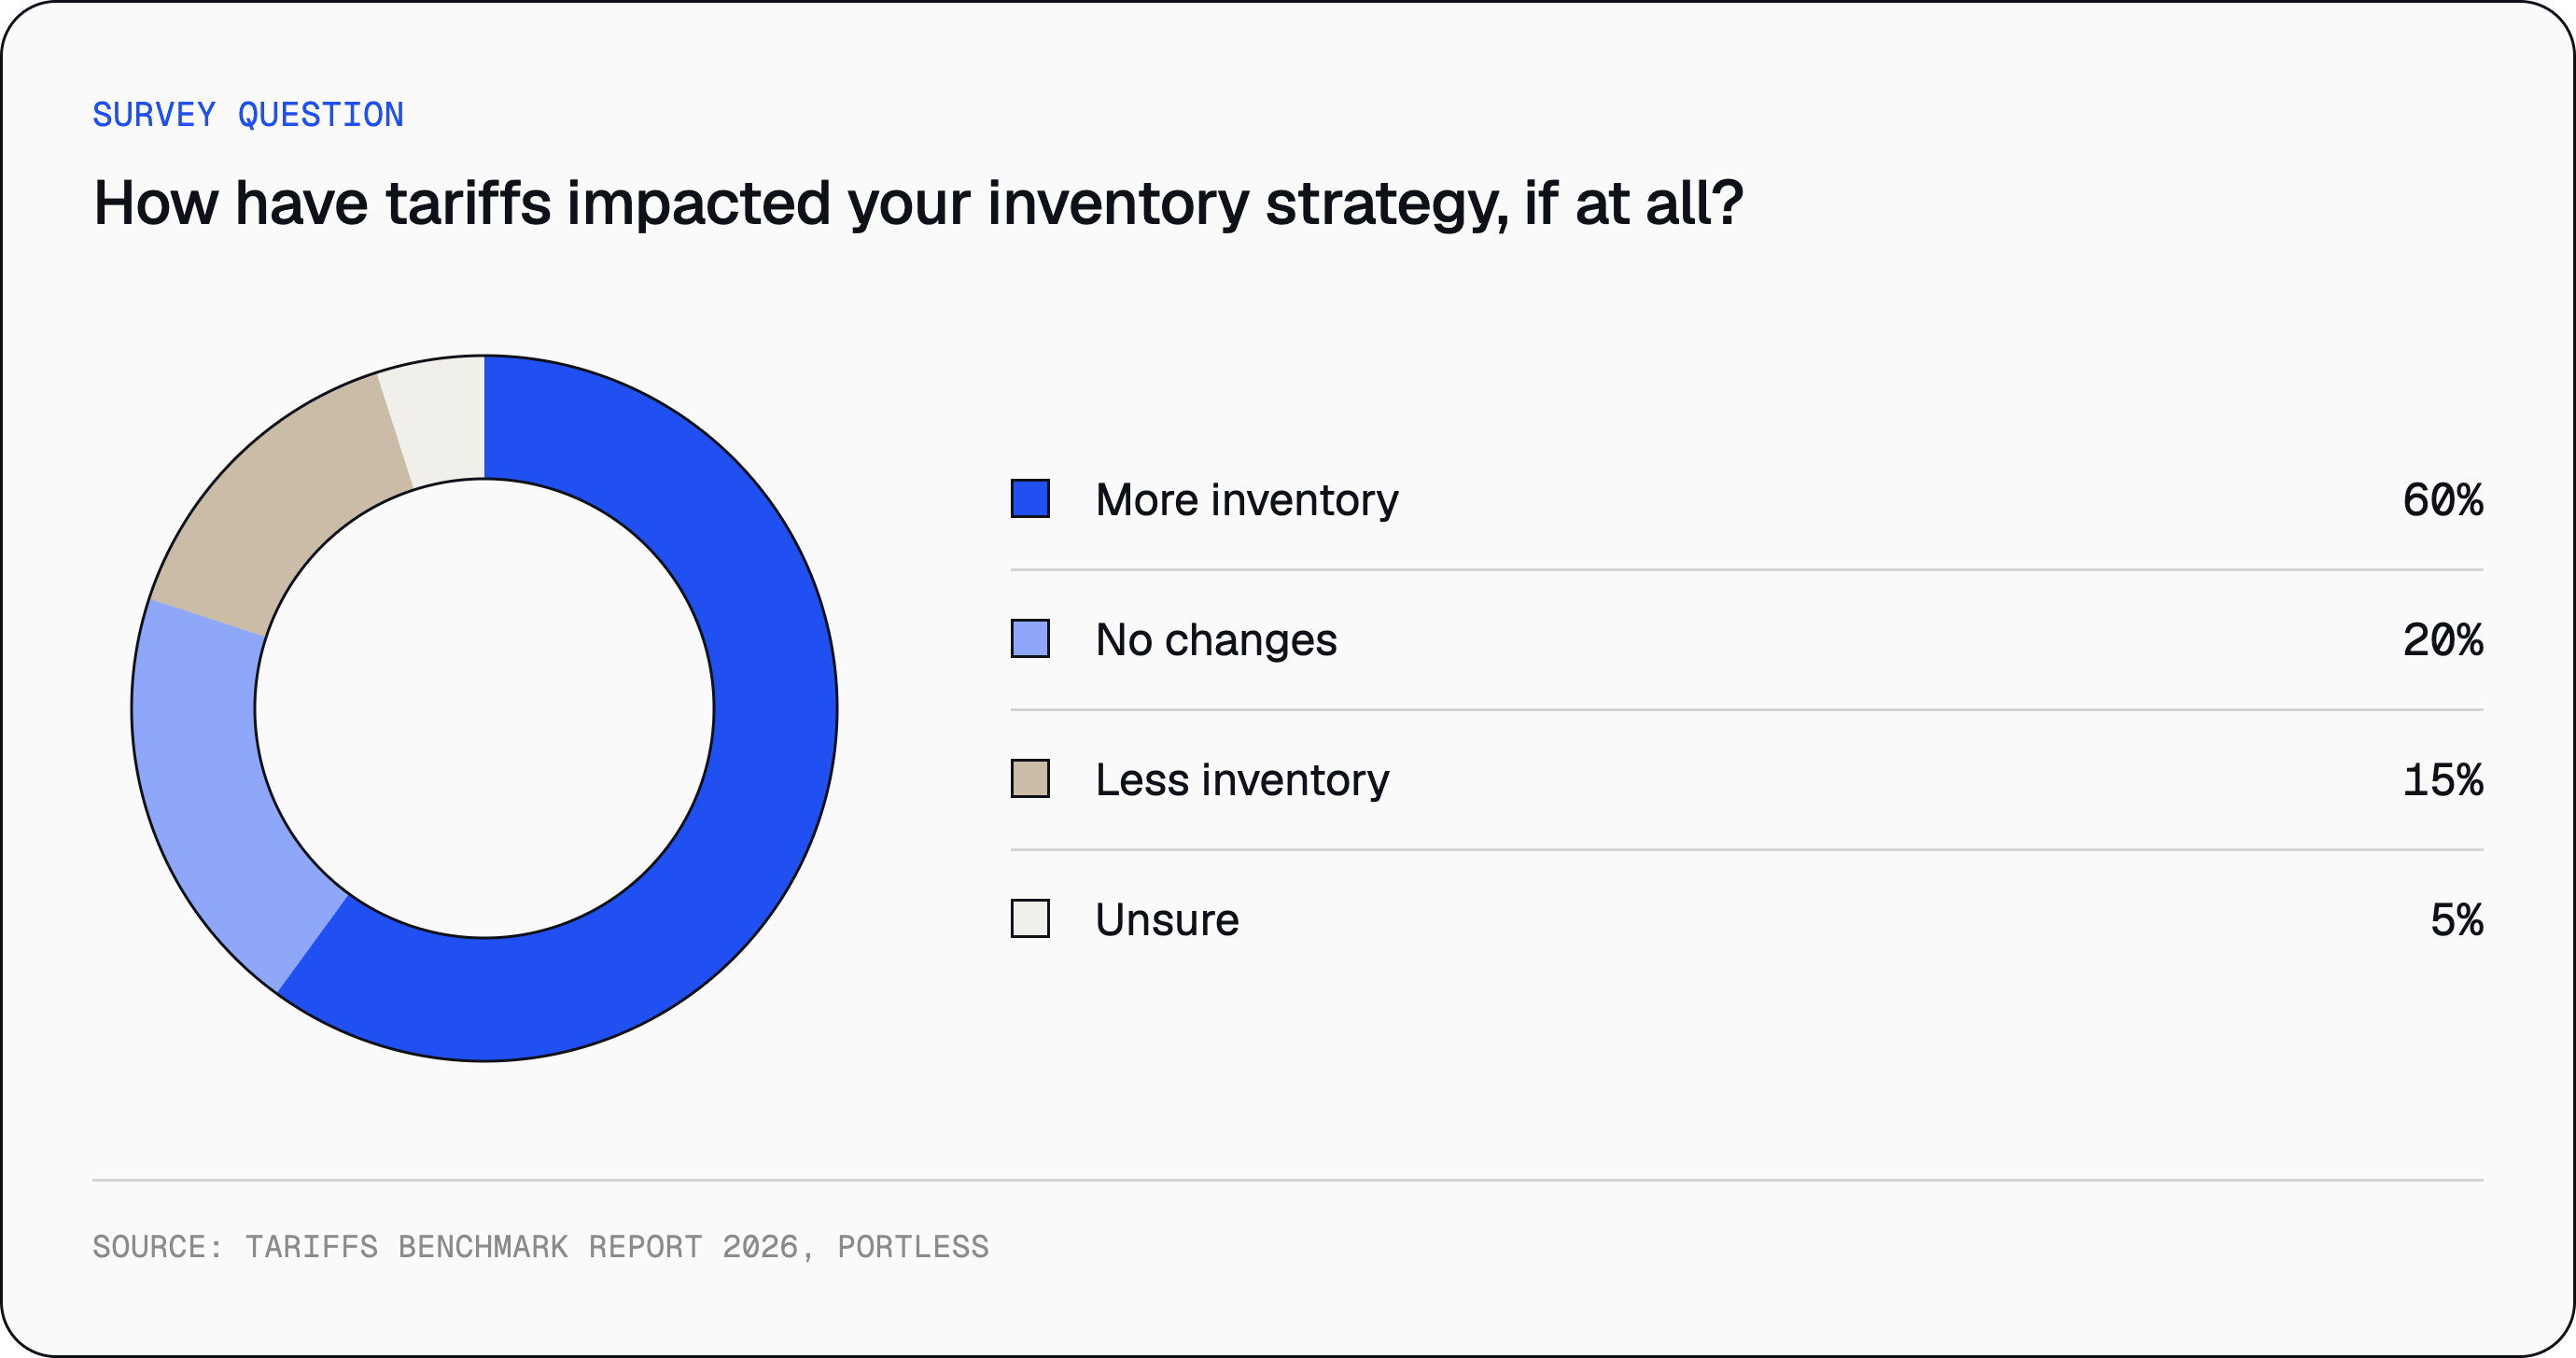
The natural response is to hold more buffer stock. But that ties up even more cash and bets more inventory on markets you haven't proven yet. 60% of brands say they're carrying more inventory than before, even though stockouts and overstocking are still top complaints.
Which number is setting your ceiling?
No single number tells you why profit stalled. But put a few together and a pattern usually shows up. Here are five to watch:
::table
Signal;What to watch for;Questions worth asking
Contribution margin;Margins fall as fulfillment or duties eat more of each sale;Which variable cost is rising fastest?
Cash conversion cycle;It takes longer to turn your inventory into cash;Where is our working capital getting stuck?
Inventory days of cover;Total stock keeps rising, but bestsellers still sell out;Which SKUs or markets are holding the excess?
Revenue concentration;One market or product drives most of your sales;What happens if demand or costs suddenly change?
Cost of your next test;Every new product or market needs more upfront cash;How much do we need just to prove demand?
:table
One number moving the wrong way for a month isn't a crisis. Watch the trend, not the single reading. Then break it down by SKU or market to see what's really driving it.
For example: if your margin falls while your cash conversion cycle and inventory days climb, you're spending more on stock and waiting longer to get paid back. But if those three are steady and it's your sales that are slowing, the problem sits somewhere else in the business.
AI tools can help by tracking these numbers across your stack and flagging changes as they happen. From there, you can dig in and check what's really going on day to day.
Fulfillment problems show up in the financials
If fulfillment feels like the problem, your financial statements can show you where the pressure starts.
The tricky part is that fulfillment costs never sit in one line. They're spread across your profit and loss, balance sheet, and cash flow statement. So, again, read them together to spot the pattern:
::table
Statement;What to track;The big question
Profit and loss;Gross margin, contribution margin, fulfillment costs;Are you keeping less profit from each sale as revenue grows?
Balance sheet;Inventory value and available working capital;Is inventory soaking up your cash faster than you can sell it?
Cash flow;Cash conversion cycle;How long until the money you pay suppliers comes back as usable cash?
:table
Watch the direction, not a target number. If your inventory value, fulfillment costs, and cash conversion cycle are all rising faster than sales, the problem is probably in how you fulfill orders.
How expensive is your next experiment?
Trying a new product or market is usually the first move when you hit a ceiling. But it's a big gamble when every test means new warehouse space, staff, and contracts. Before you commit, ask:
Can we test this without opening another warehouse?
Can our existing inventory cope if demand jumps?
Can we pull the plug without leaving stock stranded?
How quickly can we move our cash somewhere else if we need to?
If you answered "no" to any of these, work out the full cost before you go further. How much will you spend before your first sale? And what will it cost to back out if demand disappoints?
This matters most when you go international. If every warehouse runs on its own, you have to split stock, set up shipping, and sign a partner long before you know if anyone will buy. That turns a cheap "what if?" into a decision that's hard to undo. Our landed cost calculator shows how much your fulfillment might be eating into your margins.
Take that friction away and the numbers move. Portless looked at 89 merchants on its direct fulfillment platform and counted a market as "committed" once it passed 50 orders a month. Within three months, 34% had opened a new committed market, and none had pulled out of one. It fits the wider trend: in our US tariff impact survey, 71.4% of brands said tariffs had pushed them to expand abroad, or at least consider it. None of this promises a new market will work. Localization and marketing still decide that. But it makes testing one far less risky.
Direct fulfillment offers an alternative
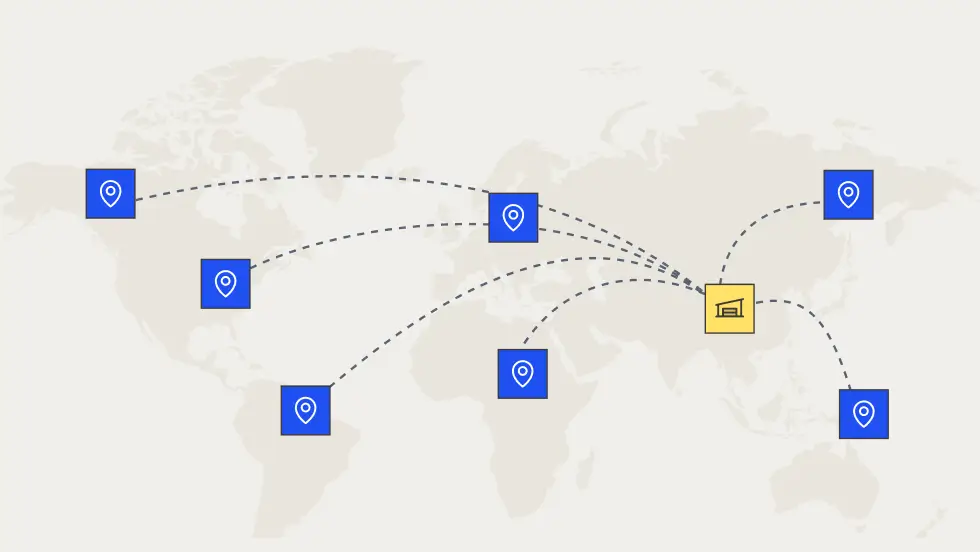
One way to make expansion safer is direct fulfillment. You hold a single pool of inventory near where it's made, and your direct fulfillment partner handles storage, picking, packing, customs, and delivery. That changes when and where your cash goes out, letting you:
Shorten lead times so you start earning money back on products sooner
Pay tariffs only as orders come in, instead of one big upfront bill
Skip paying to store the same products across dozens of markets
Keep more working capital free for growth
It also lets you follow demand as it happens. Every market pulls from the same pool, so you ship against real orders instead of a forecast you made six months ago. If a product suddenly takes off in the Philippines, you can serve it in days, not wait for the next boat.
You still own your products, inventory, packaging, and customer experience. The only difference is that your stock stays available to every market until an order comes in.
How memobottle lifted its ceiling by consolidating six warehouses into one
memobottle served customers in over 70 countries through six regional warehouses. That footprint kept products close to customers, but it also tied up a lot of cash. Storage costs reached $25,000 to $30,000 a month during peak periods, and ocean freight stretched the brand's cash conversion cycle beyond 120 days.
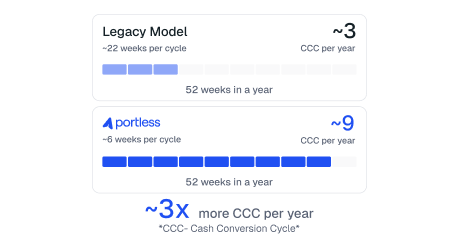
Switching to a direct fulfillment model changed the maths. The brand is consolidating its inventory into one hub near the point of production. Once that's done, it expects to cut its cash conversion cycle by more than 100 days and reduce its inventory holdings by 5x.
Direct fulfillment isn't the right answer for every business. But memobottle shows how a brand with strong demand and a proven product can transform its economics by changing how it holds and ships inventory.
Put more of your working capital back to work
Growth ceilings are frustrating because the usual levers don't shift them. If margins are tightening and cash is slow to come back, spending more just adds pressure without fixing the cause.
Once you know where the pressure is, you can point your money at what's actually holding you back.
Direct fulfillment won't guarantee every product or market lands. But it makes each experiment faster and easier to walk back, which gives you more shots at lifting the ceiling and finding your next stretch of profitable growth.
Portless helps Ecommerce brands hold inventory closer to production and ship orders across 85+ countries. That means you keep sight of your stock, free up the cash tied in regional warehouses and ocean freight, ship against live demand, and test new markets with confidence. Learn more about how it works or request a demo.
FAQ
What causes an Ecommerce brand to hit a growth ceiling?
Usually, a brand hits a growth ceiling when the business can't support the next stage of expansion. The block could be demand, margins, cash flow, inventory, systems, or a saturated market. Growth tends to make these weak spots more obvious. And once you hit the ceiling, revenue can keep rising even as profit margins fall.
How do I know whether my growth problem is marketing or fulfillment?
Compare your demand signals with your operations. If traffic, conversion, and retention are slipping across channels, look at your sales funnel first. If orders are healthy but margins are falling and cash is slow to return, fulfillment is the more likely culprit.
Which metrics should I track to diagnose the issue?
Track contribution margin, cash conversion cycle, inventory days of cover, and revenue concentration. Read them together and as a trend, not one at a time. Analytics can then trace the pattern back to a specific product or market so you can pin down the cause.
Frequently asked questions
Heading
Lorem ipsum dolor sit amet, consectetur adipiscing elit. Suspendisse varius enim in eros elementum tristique. Duis cursus, mi quis viverra ornare, eros dolor interdum nulla, ut commodo diam libero vitae erat. Aenean faucibus nibh et justo cursus id rutrum lorem imperdiet. Nunc ut sem vitae risus tristique posuere.
Get operator-level supply chain insights
Thank you! Your submission has been received!
Oops! Something went wrong while submitting the form.








.jpg)