Revenue is up, but cash is tight. Support tickets climb every week, and your third-party logistics (3PL) partner sends a monthly report with 40 rows you never have time to read. The fulfillment metrics every founder should track fit on one screen. They cover service, speed, cost, and cash, and you can calculate each one from order data you already have.
Which fulfillment metrics should a founder track first?
Start with order accuracy rate, on-time shipping rate, landed cost per order, and days of inventory outstanding. That gives you one service metric, one speed metric, one cost metric, and one cash metric. Accuracy and on-time shipping tell you whether your fulfillment partner keeps its promises. Landed cost per order and days of inventory tell you what those promises cost and how long your cash stays tied up in stock.
Add the rest once you trust the data behind the first four.
::table
Metric;Formula;Target;Review cadence
Order accuracy rate;Orders shipped without errors ÷ total orders shipped × 100;Above 99.68% (WERC best-in-class);Weekly
On-time shipping rate;Orders shipped within SLA ÷ total orders shipped × 100;Above 99.5% (WERC best-in-class);Weekly
On-time delivery rate;Orders delivered by the promised date ÷ total orders delivered × 100;Beat your trailing 90 days, by country;Weekly
Return rate;Units returned ÷ units sold × 100, by SKU;Fulfillment-caused returns trending toward zero;Monthly
WISMO contacts per 100 orders;WISMO tickets ÷ orders shipped × 100;Falling month over month;Weekly
Order fulfillment cycle time;Delivery date − order date, averaged;Inside the delivery window shown at checkout;Weekly
Production-to-sellable lead time;Date stock is available to sell − date production finishes;Shorter with each production run;Every production run
Landed cost per order;All product, freight, duty, storage, fulfillment, and shipping costs ÷ orders shipped;Flat or falling as volume grows;Monthly
Days of inventory outstanding (DIO);Average inventory ÷ annual COGS × 365;Below your category's typical range;Monthly
Cash conversion cycle (CCC);DIO + DSO − DPO;Shorter each quarter;Monthly
In-stock rate on hero SKUs;Days in stock ÷ days in the period × 100;As close to 100% as your lead time allows;Weekly
:table
Service metrics show whether customers get what they paid for
Service metrics measure the promise you make at checkout. The customer paid for a specific item, delivered intact, by a specific date. When any part of that promise breaks, the cost shows up later as a refund, a reship, a support ticket, or a customer who never orders again.
Your fulfillment partner controls most of these numbers day to day, so review them every week.
Order accuracy rate
Order accuracy rate is the share of orders that ship with the right items, in the right quantities, to the right address.
Order accuracy rate = orders shipped without errors ÷ total orders shipped × 100
Ask your fulfillment partner to define "error" in writing. Some partners count only mispicks. A useful definition also counts missing items, wrong variants, damaged units, and wrong addresses.
One mispick sets off a chain of costs. You send a replacement unit on a second shipping label, someone on your team answers the complaint, and you pay to bring the first unit back.
The bar for accuracy is high. The WERC 2025 DC Measures benchmarks, summarized in a Yale white paper, report that "best-in-class operations pick more than 99.68% of their orders correctly." Best-in-class there means the top 20% of respondents. Portless reports 99.8% pick-and-pack accuracy across its operation.
On-time shipping rate vs. on-time delivery rate
The two metrics sound alike, but they hold different parties accountable.
On-time shipping rate measures the warehouse. It's the share of orders that leave the dock within your service level agreement (SLA), such as same day or next business day. On-time delivery rate measures the whole network, including the carrier. It's the share of orders that reach the customer by the date you promised.
On-time shipping rate = orders shipped within SLA ÷ total orders shipped × 100
On-time delivery rate = orders delivered by the promised date ÷ total orders delivered × 100
WERC's best-in-class operations "ship more than 99.5% of orders on time," which the benchmark defines as off the dock and in transit to the customer. Use that figure as the target in your fulfillment contract.
Customers feel on-time delivery more than raw speed. In the McKinsey delivery preferences survey of more than 1,000 US consumers, published in February 2025, respondents ranked on-time delivery as more important to their satisfaction than speedy delivery. More than 80% said they'd still buy when delivery takes four to seven days, as long as it's free.
Late deliveries cost repeat orders. The Narvar 2025 post-purchase report surveyed 3,461 US online shoppers in August 2025. Seventy-four percent had a late delivery in the past year. After a single bad experience, 60% of shoppers aged 18–29 said they wouldn't shop with that retailer again, compared with 17% of shoppers 60 and over.
A delivery window you hit every time earns more trust than a shorter one you miss. Portless makes the case for Ecommerce shipping speed built on reliability, with specific delivery dates and clear tracking. Measure delivery against the date you showed at checkout, and break it out by country.
Return rate
Return rate = units returned ÷ units sold × 100
Calculate return rate by SKU and by sales channel, since a blended rate hides the one product with a sizing problem.
Then split returns by cause. Wrong item, damaged in transit, and arrived too late are fulfillment-caused returns, and your partner should own them. Didn't fit, didn't like it, and changed my mind are product returns, and they point to your product pages, size guides, or the product itself.
For context, the NRF 2025 returns report, produced with Happy Returns, estimated that 19.3% of online sales would be returned in 2025. Rates vary widely by category, so compare against your own history before you compare against an industry average.
Returns move through reverse logistics, the flow that carries goods from the customer back through your supply chain. Portless explains how to turn returns into profit by recovering resellable stock and verifying items early.
WISMO contacts per 100 orders
Where is my order? (WISMO) contacts are tickets from customers asking where their parcel is. They work as an early warning. Customers often notice a stalled tracking page before late deliveries show up in a carrier report.
WISMO contacts per 100 orders = WISMO tickets ÷ orders shipped × 100
Tag WISMO tickets in your helpdesk so you can pull the count every week. Helpdesk software company Gorgias, in a 2023 post on automating WISMO requests, put WISMO at 18% of incoming support requests on average, based on its own data.
A rising WISMO count usually means one of two problems. Parcels are late, or tracking goes quiet for too long after the label prints. Milestone updates by email and SMS, plus a branded tracking page, help you reduce WISMO tickets before customers feel the need to ask.
Speed metrics should cover the whole timeline from factory to front door
Many fulfillment reports start the clock when the customer places an order. That clock covers only the last stretch. The earlier stretch runs from the day production finishes to the day a customer can buy the unit. For brands that manufacture overseas, the earlier stretch is usually the longer one, and it decides how much cash sits in transit.
Order fulfillment cycle time and delivery time
Order fulfillment cycle time = delivery date − order date
Split cycle time into processing time and transit time. Processing time runs from order placed to parcel handed to the carrier, and your fulfillment partner owns it. In the WERC 2025 DC Measures data, best-in-class operations reported order cycle times under six hours. Transit time runs from carrier handoff to delivery, and it depends on the carrier, the route, and customs.
If you sell internationally, report delivery time by destination country. A single blended average hides the market where parcels take twice as long. Duties belong in this metric too. A parcel held for duty payment can add days to delivery, and the customer may have to pay before it's released. Under Delivered Duty Paid (DDP) terms, the seller covers duties and taxes, so the customer has nothing left to pay on arrival.
Health and wellness brand Cosara watched this metric through a fulfillment switch. With its previous partner, tracking was unreliable and orders took 15+ days to arrive. After the move, Cosara's average global delivery time fell to 6–8 days. Laura McDowell, COO at Cosara, describes the period before the switch. "We were losing business slowly."
Production-to-sellable lead time
Production-to-sellable lead time = date stock is available to sell − date production finishes
In the legacy model, this window includes freight consolidation, weeks at sea, port clearance, domestic trucking, and warehouse receiving. WERC's best-in-class dock-to-stock time is under 3.5 hours, but that clock starts only after goods reach the receiving dock. You've already paid for the inventory on every day it spends in transit before that.
Lead time also sets how far ahead you forecast. A 90-day lead time means committing to demand three months out.
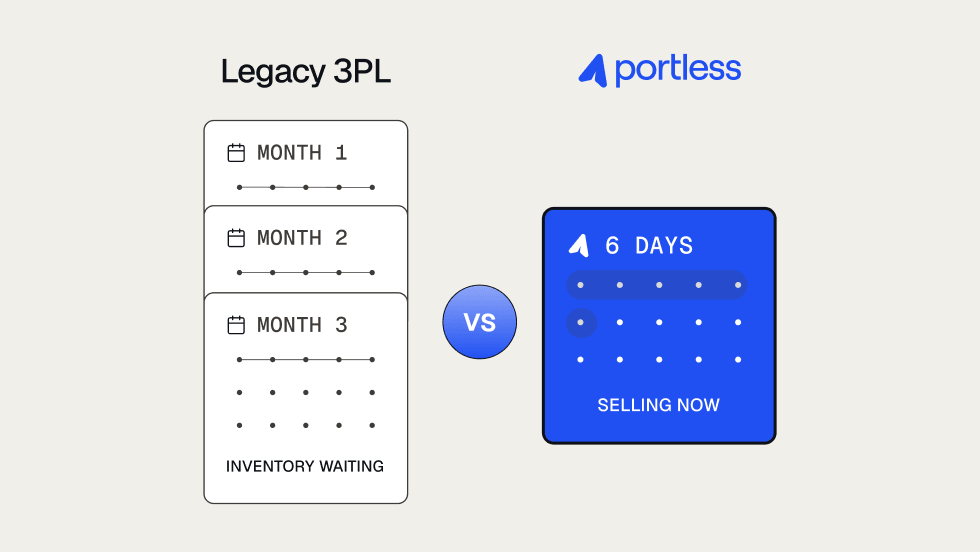
Sleep products brand Ugly Sleep Club, which manufactures in China, cut its inventory lead time from three to four months to days. Founder Grace Clark explains the cash effect in Ugly Sleep Club's lead time results. "Our cash flow is so fast that we are able to buy a new product, get it into our warehouse the day after it's finished."
Track landed cost per order alongside fulfillment fees
Many 3PL reports show only fee-level cost per order. Extensiv's 3PL benchmark data, cited in Portless's guide to fulfillment at each growth stage, puts typical pick and pack fees at $2 to $5 per order.
Fee-level cost per order = (pick and pack fees + packaging + postage) ÷ orders shipped
That number leaves out every cost upstream of the warehouse. Landed cost is the total cost of moving a product from the factory to the customer. It includes product cost, freight, duties and taxes, insurance, and fulfillment. Per order, the formula adds those upstream costs back in.
Landed cost per order = (product cost + inbound freight + duties + insurance + storage + pick and pack + packaging + last-mile shipping + returns processing) ÷ orders shipped
The gap between the two numbers is where legacy fulfillment hides cost. Storage fees grow every week inventory sits. Inbound freight and duties get paid months before a sale. Receiving fees, storage overages, and exit fees rarely appear on a quote, which Portless covers in the hidden costs of cheap fulfillment.
No external benchmark for landed cost per order holds up across brands, because product cost and duty rates vary too much by category. Build your own baseline per SKU with real shipping volumes and current duty rates, then track it monthly. Portless shows how to calculate product landed costs with a worked example. Portless's growth-stage guide also flags fulfillment costs above 15% of revenue as a sign it's time to leave a legacy 3PL.
Cash metrics turn fulfillment into a finance decision
Brands pay for manufacturing, freight, duties, and warehousing months before a product sells, which Portless covers in its overview of the cash flow risks growing Ecommerce brands face. Cash metrics show how long that money stays locked in inventory. Your accountant may already track them. Your fulfillment model sets them.
Days of inventory outstanding
Days of inventory outstanding (DIO) measures how long stock sits before it sells.
DIO = average inventory ÷ annual cost of goods sold (COGS) × 365
Portless's DIO guide gives rough ranges for DTC brands by category.
- Beauty and personal care 60–120 days
- Consumer electronics 45–90 days
- Home goods 75–150 days
- Apparel and fashion 90–180 days, often higher for seasonal lines
Lower is generally better, but a DIO that drops too low can signal stockout risk. Some finance teams track the same figure as inventory turnover rate, which counts how many times you sell and replace stock in a period.
The legacy model pushes DIO up in two ways. Goods spend weeks at sea before they reach a shelf, and long lead times force brands to hold extra safety stock. Portless's growth-stage guide lists inventory that sits 60 to 120 days before it sells as another sign to leave a legacy 3PL.
Cash conversion cycle
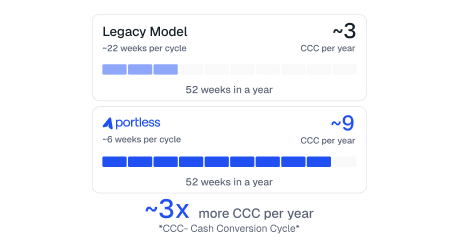
Cash conversion cycle (CCC) = DIO + DSO − DPO
Days sales outstanding (DSO) measures how long customers take to pay you. Days payable outstanding (DPO) measures how long you take to pay suppliers. DSO stays low for most DTC brands because customers pay at checkout. That leaves DIO as the biggest lever, as Portless explains in its guide to the cash conversion cycle in Ecommerce. Longer supplier terms help, but cutting inventory days moves CCC further.
The same guide puts the typical CCC for Ecommerce and DTC brands at 30–90 days. On Portless's comparison page, most brands go from a roughly 90-day cash conversion cycle to about six weeks after moving to direct fulfillment.
In-stock rate on hero SKUs
A stock keeping unit (SKU) is the code for each product variant. Hero SKUs are the handful that drive most of your revenue and ad spend.
In-stock rate = days in stock ÷ days in the period × 100, measured per hero SKU
The revenue lost while a hero SKU sits at zero is only part of the damage. Search and social ads keep sending clicks to product pages nobody can buy from. Organic rankings that reward sales velocity slip. Some customers switch brands and never come back. Portless breaks down the real cost of a stockout with a worked example.
Grace Clark, founder of Ugly Sleep Club, puts the stakes plainly. "Going out of stock completely stops everything. You have to turn off all your ads."
Track in-stock rate weekly during peak. A shorter lead time lets you reorder closer to demand and guess less.
Build a fulfillment dashboard that matches your stage
A founder shipping 800 orders a month and a founder shipping 12,000 need different dashboards. Start with the first four metrics and add the rest as volume and complexity grow.
::table
Orders per month;Metrics to track;Review weekly;Review monthly
Under 1,000;Order accuracy, on-time shipping, landed cost per order, DIO;Order accuracy, on-time shipping;Landed cost per order, DIO
1,000–5,000;Add on-time delivery by country, WISMO per 100 orders, return rate by cause, in-stock rate on hero SKUs;Service metrics and in-stock rate;Landed cost per order, DIO, return rate
5,000–15,000;Add cycle time split by processing and transit, production-to-sellable lead time, CCC;Service and speed metrics;Landed cost per SKU, DIO, CCC, lead time per production run
:table
Once you have a baseline, set a target for each service metric. Write the targets into your SLA with your fulfillment partner, along with what happens when the partner misses them.
Strong numbers can also work as marketing. Portless's piece on fulfillment data as marketing recommends publishing trailing performance, such as the share of orders shipped on time over the past 90 days.
Your fulfillment model decides which of these numbers you can move at all. Who holds the inventory and who ships the order set your lead time, DIO, and landed cost before any dashboard does.
::table
Model;Who holds the inventory;Who ships the order;Metrics you can move;Best for
In-house;You, in your own space;Your team;All of them, at the cost of your own time and labor;Early brands with low volume
Legacy 3PL;A domestic warehouse in each market;The 3PL, through domestic carriers;Service metrics, through the SLA. Lead time and DIO stay long because stock crosses the ocean first.;Heavy or bulky goods and brands that need next-day domestic delivery
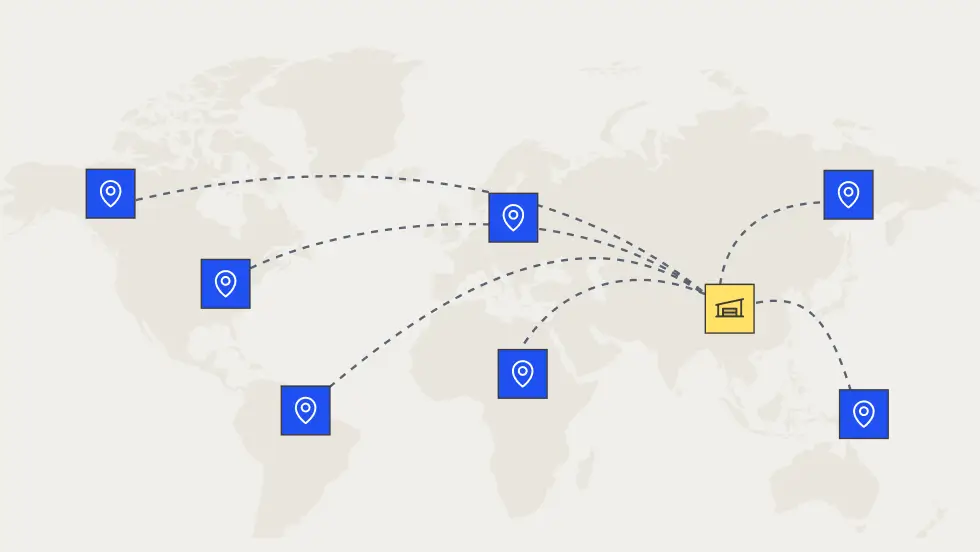
Direct fulfillment;A fulfillment center close to the point of manufacture;The platform, by air with direct injection into local last-mile carriers;Service, speed, cost, and cash metrics from one hub;Brands past roughly 1,000 orders a month selling lightweight, non-regulated products in several countries
:table
To see how a shorter lead time changes the cash you need on hand, run your numbers through the direct fulfillment ROI calculator. It compares the maximum cash outlay for a legacy model against direct fulfillment.
See how Portless works
The metrics that hurt most (days of inventory, lead time, and landed cost) depend on your fulfillment model more than on your dashboard. A dashboard shows where cash is stuck. A different model frees it.
Portless is a direct fulfillment platform for DTC Ecommerce brands. It ships orders from its own fulfillment center in China, close to the point of manufacture, to customers in 85+ countries, with five-to-eight-day average global delivery. Inbounding takes one business day, 99.8% of orders ship within a day, and parcels reach customers through direct injection into local last-mile carriers. Portless also handles customs clearance and duties, so customers don't get a surprise duty bill at the door.
Learn how direct fulfillment works, or book a demo to see what your own metrics would look like.